JEE MAIN 2012Mean, median and modeTRANSCRIBED
The frequency distribution of daily working expenditure of families in a locality is as follows:
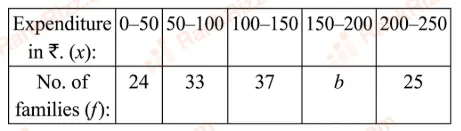
If the mode of the distribution is Rs. 140, then the value of is
- A
34
- B
31
- C
26
- D
36
Every Statistics question JEE Main has set, grouped by the idea it tests rather than the order of the syllabus. 155 questions across 4 distinct ideas. Free to read, answer key on every one.
Questions
155
Distinct ideas
4
Share of marks
3%
Difficulty
MEDIUM
A chapter is not one subject — it is a handful of procedures the examiner reuses. These are the ones Statistics questions actually test.
141–155 OF 155 · NEWEST FIRST
The frequency distribution of daily working expenditure of families in a locality is as follows:
If the mode of the distribution is Rs. 140, then the value of is
34
31
26
36
Statement 1: The variance of first odd natural numbers is . Statement 2: The sum of first odd natural number is and the sum of square of first odd natural numbers is .
Statement 1 is true, Statement 2 is false.
Statement 1 is true, Statement 2 is true; Statement 2 is not a correct explanation for Statement 1.
Statement 1 is false, Statement 2 is true.
Statement 1 is true, Statement 2 is true, Statement 2 is a correct explanation for Statement 1.
The median of observations grouped in classes of equal width is . If the median class interval is and the number of observations less than is , then the frequency of median class is
If the mean of and is , then the mean deviation from the median of these observations is
If the mean deviation about the median of the numbers is , then equals:
For two data sets, each of size , the variances are given to be and and the corresponding means are given to be and , respectively. The variance of the combined data set is
If the mean deviation of number from their mean is , then the is equal to
Statement-1 : The variance of first even natural numbers is . Statement-2 : The sum of first natural numbers is and the sum of squares of first natural numbers is .
Statement-1 is true, Statement-2 is true; Statement-2 is a correct explanation for Statement-1
Statement-1 is true, Statement-2 is true; Statement-2 is not a correct explanation for Statement-1
Statement-1 is true, Statement-2 is false
Statement-1 is false, Statement-2 is true
The mean of the numbers is 6 and the variance is 6.80. Then which one of the following gives possible values of and ?
The average marks of boys in a class is 52 and that of girls is 42. The average marks of boys and girls combined is 50. The percentage of boys in the class is
40
20
80
60
Suppose a population has observations , and another population has observations . If and represent the variances of the two populations, respectively, then is
1
If in a frequently distribution, the mean and median are and respectively, then its mode is approximately
Let be observations such that and . Then a possible value of among the following is
Consider the following statements:
(a) Mode can be computed from histogram.
(b) Median is not independent of change of scale.
(c) Variance is independent of change of origin and scale.
only (a)
only (b)
only (a) and (b)
(a), (b) and (c)
In a series of observations, half of them equal and remaining half equal . If the standard deviation of the observations is , then equals
OTHER MATHS CHAPTERS